http://eavoices.com/2013/07/29/how-to-build-a-roadmap-sequence/
An earlier post (How to Build a Roadmap) in this series summarized the specific steps required to develop a well thought out road map. This roadmap identified specific actions using an overall pattern ALL roadmaps should follow. The steps required to complete this work:
- Develop a clear and unambiguous understanding of the current state
- Define the desired end state
- Conduct a Gap Analysis exercise
- Prioritize the findings from the Gap Analysis exercise into a series of gap closure strategies
- Discover the optimum sequence of actions (recognizing predecessor – successor relationships)
- Develop and Publish the Road Map
This post explores the step where we discover the optimum sequence of actions recognizing predecessor – successor relationships. This is undertaken now that we have the initiatives and the prioritization is done. What things do we have to get accomplished first, before others? Do any dependencies we have identified need to be satisfied before moving forward? What about the capacity for the organization to absorb change? Not to be overlooked, this is where a clear understanding of the organizational dynamics is critical (see step number 1, we need to truly understand where we are). 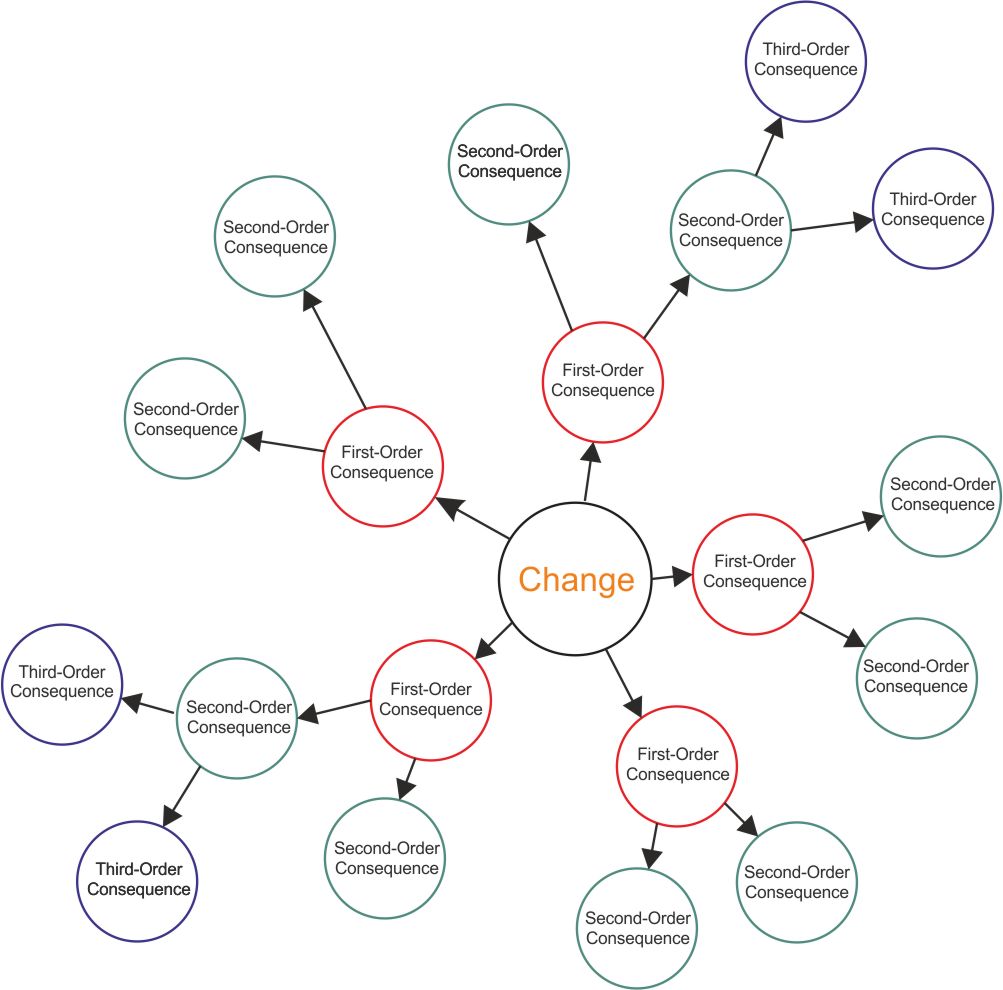 The goal is to collect and group the set of activities (projects) into a cohesive view of the work ordered in a typical leaf, branch, and trunk pattern so we can begin to assemble the road map with a good understanding what needs to be accomplished in what order.
Finding or discovering the optimal sequence of projects within the larger program demands you be able to think across multiple dimensions recognizing where there may be second and third order consequences for every action undertaken (see the Future Wheel method for more on this). More of craft than a science the heuristic methods I use refer to experience-based techniques for problem solving, learning, and discovery. This means that the solution is not guaranteed to be optimal. In our case, where an exhaustive search is impractical, I think using heuristic methods to speed up the process of finding a satisfactory solution include using rules of thumb, educated assumptions, intuitive judgment, some stereotyping, and lot of common sense. In our case optimization means finding the “best available”  ordered set of actions subject to the set of priorities and constraints already agreed upon. The goal is to order each finding from the Gap Analysis in a way that no one project within the program is undertaken without the pre-requisite capability in place. Some of you will see the tree diagram image is a Work Breakdown Structure. And you are right. This is after all our goal and represents the end-game objective. The sequencing is used and re-purposed directly into a set of detailed planning products organized to guide the effort.
What to think about
Developing a balanced well-crafted road-map is based on the “best available” ordered set of actions subject to the set of priorities (and constraints) already agreed upon. When you think about this across multiple dimensions it does get a little overwhelming so I think the best thing to do is break the larger components into something we can attack in pieces and merge together later. After this set of tasks is accomplished we should always validate and verify or assumptions and assertions made to ensure we have not overlooked a key dependency.
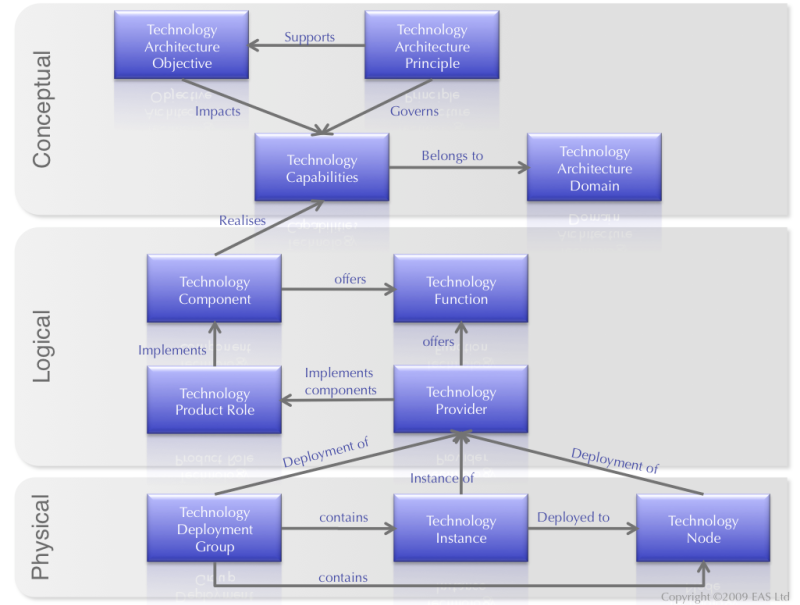 I’m not going to focus on the relatively straight forward task in the technology (infrastructure) domains many of us are familiar with. Following a simple meta-model like this one from the Essential Architecture project (simplified here to illustrate the key concepts) means we can grasp quickly the true impact of an adoption of a new capability would have, and what is needed to realize this in the environment as planned. Where I will focus is on the less obvious. This is the relationships across the other three domains (Business, Information, and Applications) which will be dependent on this enabling infrastructure. And no less important is the supporting organization ability to continue to deliver this capability when the “consultants” and vendors are long gone.
So if you look at the simple road map fragment illustrated below note the technology focus. Notice also what is missing or not fully developed. Although we have a bubble labeled “Build Organizational Capability” it is not specific and detailed enough to understand how important this weakness is to overcoming an improved product because of the technology focus.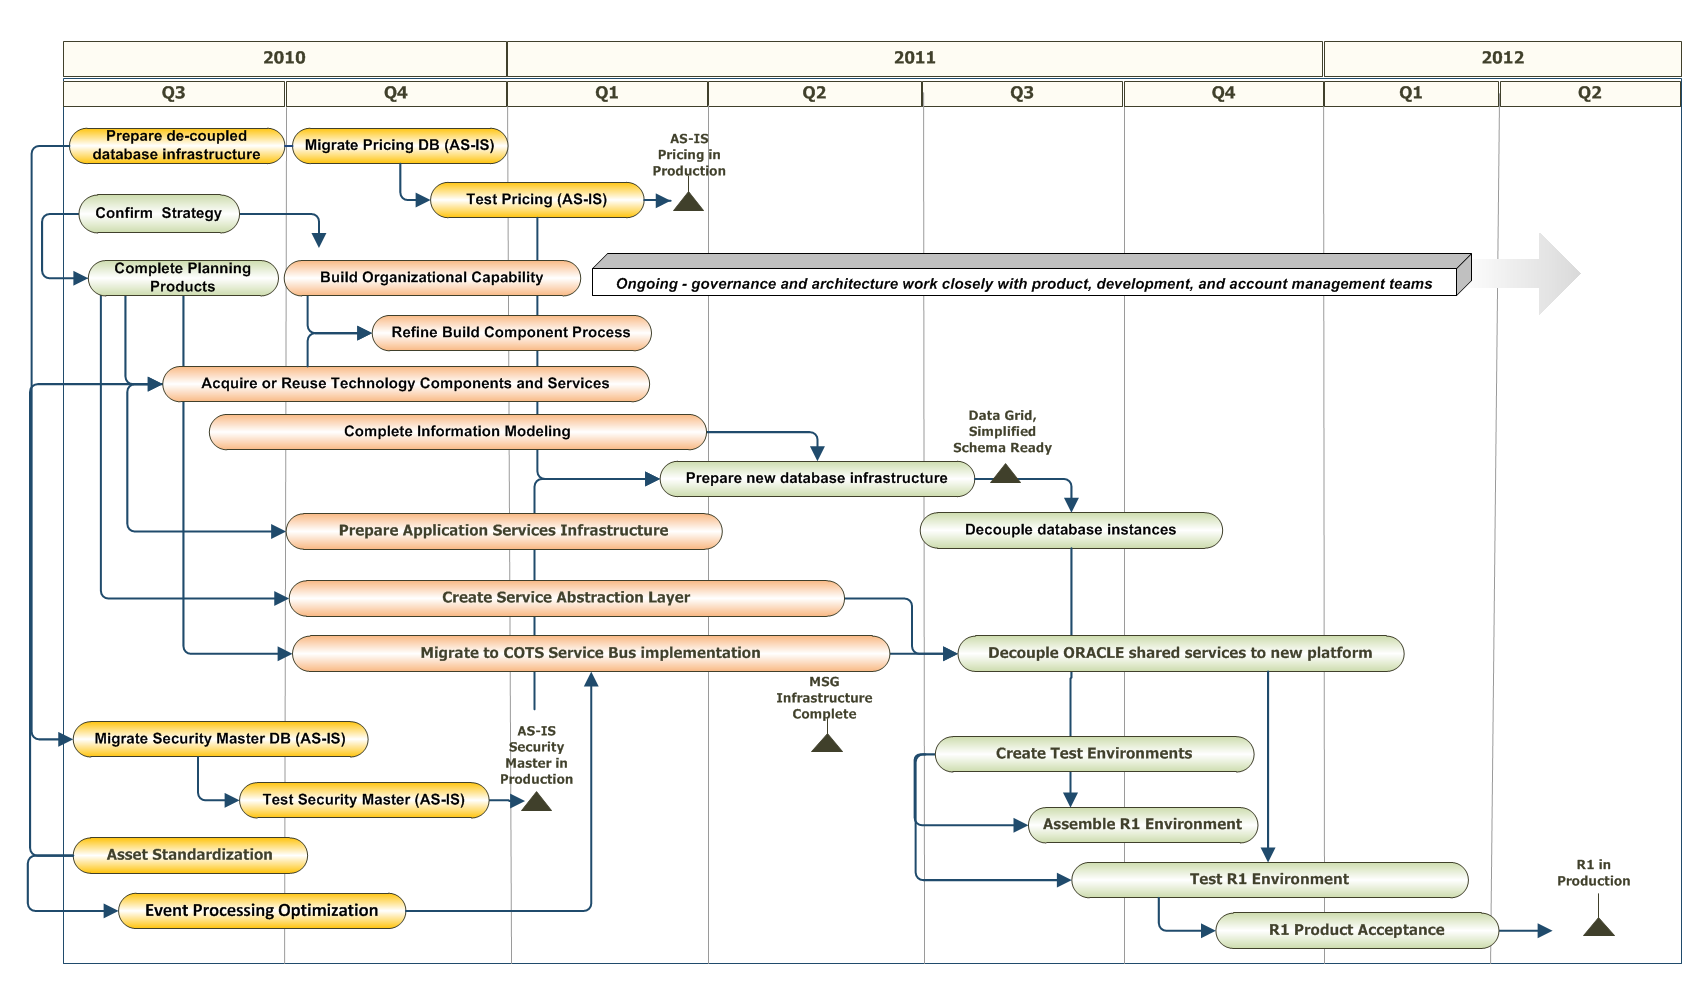 Understanding of this one domain (technology) becomes a little trickier when take into account and couple something like an Enterprise Business Motivation Model for example . Now we can extend our simple sequence optimization with a very thoughtful understanding of all four architecture domains to truly understand what the organization is capable of supporting. So I’m going to reach into organizational dynamics now assuming all of us have a very good understanding as architects of what needs to be considered in the information, application, and supporting technology domains.
Organization Maturity Models
Before diving into the sequence optimization we should step back and review some of our earlier work. As part of understanding current and desired end states we developed a pretty acute awareness of the organization profile or collection of characteristics to describe ourselves. There are many maturity models available (CMMI,Information Management Maturity Model at Mike 2.0, and the NAS CIO EA Maturity Model) that all share the same concepts usually expressed in five or six levels or profiles ranging from initiating (sometimes referred to as chaos) to optimized. Why is this important? Each of these profiles includes any number of attributes or values that can be quantified to gain a deeper understanding of capability. This where the heuristic of common sense and intuitive judgment is needed and overlooked only at the risk of failure. For example, how many of us have been engaged in a SOA based adoption only to discover the technology is readily achievable but the organization’s ability to support widespread adoption to realize the value is not manageable or produces unintended consequences. Why does this happen so often? One of the key pieces of insight I can share with you is there seems to be a widespread assumption you can jump or hurdle one maturity profile to another by ensuring all prerequisite needs are adopted and in use. Here is a real world case to illustrate this thought.
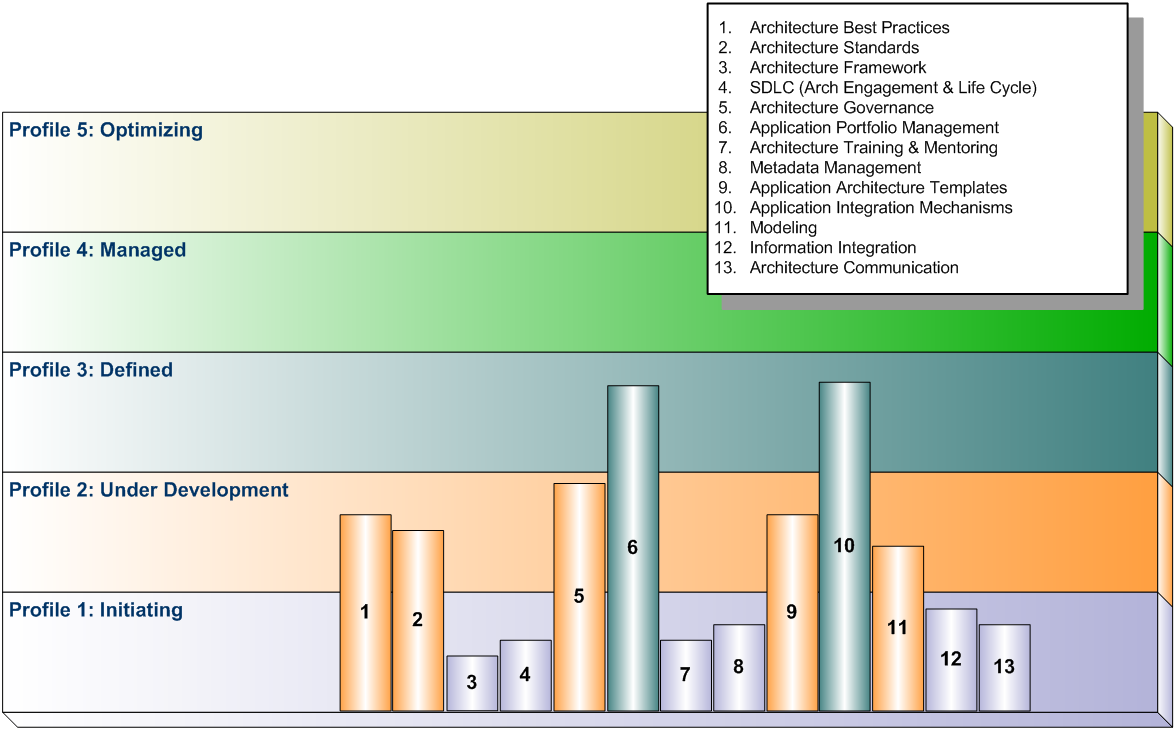
Note there were thirteen key attributes evaluated as part of the global SOA adoption for this organization. What is so striking about this profile (this is not my subjective evaluation, this is based on the client’s data) is the relative maturity of Portfolio Management and integration mechanisms and the low maturity found in some core competencies related to architecture in general. Core competency in architecture is key building block to adopting SOA on the size and scale as planned. The real message here is this organization (at least in the primary architecture function) is still a Profile 1 or Initiating. Any attempt to jump to a Defined or even Managed profile cannot happen until ALL key characteristics are addressed and improved together. The needle only moves when the pre-requisites are met. Sounds simple enough, can’t count how often something this fundamental is overlooked or ignored.
Organization Profile
This is a little more sophisticated in its approach and complexity. In this case we are going to use a maturity model that attempts to clarify and uncover some of the organizational dynamics referred to earlier in our Gap Analysis. This model is based on the classic triangle with profiles ranging from Operational to Innovating (with a stop at Optimizing along the way). Each profile has some distinct characteristics or markers we should have recognized when base lining the Current State (if you used theGalbraith Star Model to collect you findings, its results can always be folded or grouped into this model as well). Within each of the profiles there a couple of dimensions that represent the key instrumentation to measure the characteristics and attributes of the organization’s operating model. This is useful to measure as the organization evolves from one Profile to another and begins to leverage the benefits of each improvement in reach and capability.
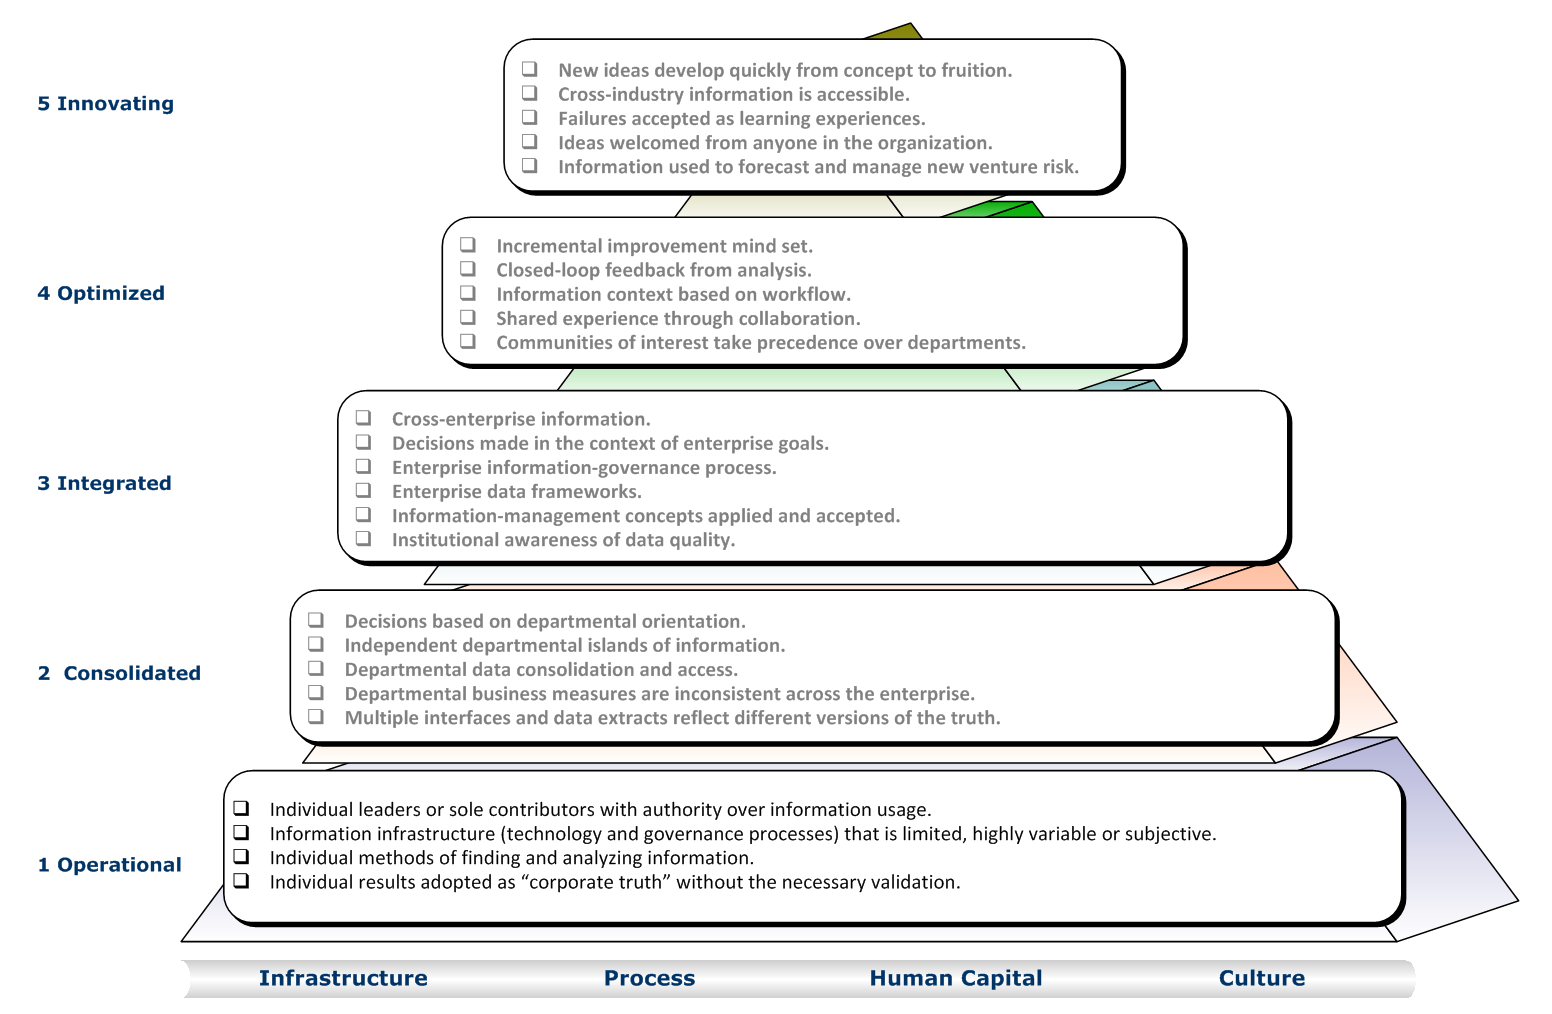
We use this to guide us to select the proper sequence. The dimensions used within each of the six profiles in this model include:
Infrastructure (Technology)
The computing platforms, software, networking tools, and technologies (naming services for example) used to create, manage, store, distribute and apply information. This is the Technology architecture domain I referred to earlier.
Processes
Policies, best practices, standards and governance that define: how information is generated, validated and used. How information is tied to performance metrics and reward systems. How the company supports its commitment to strategic use of information.
Human capital
The information skills of individuals within the organization and the quantifiable aspects of their:
-
capability,
-
recruitment,
-
training,
-
assessment and
-
alignment with enterprise goals.
Culture
Organizational and human influences on information flow — the moral, social and behavioral norms of corporate culture (as shown in the attitudes, beliefs and priorities of its members), as related to the use and value of information as a long-term strategic corporate asset.
What this reveals about our sequencing is vital to understanding key predecessor – successor relationships. For example, a Profile 1 (Initiating) organizations are usually successful due to visionary leaders, ambitious mavericks and plain good old-fashioned luck. Common characteristics include:
- Individual leaders or mavericks with authority over information usage
- Information infrastructure (technology and governance processes) that is nonexistent, limited, highly variable or subjective
- Individual methods of finding and analyzing information
- Individual results adopted as “corporate truth” without the necessary validation
Significant markers you can look for are usually found in the natural self-interests of individuals or “information mavericks” who will often leverage information to their own personal benefit. Individuals flourish at the expense of the organization. The silo orientation tends to reward individual or product-level success even as it cannibalizes other products or undermines enterprise profitability. Because success in this environment depends on individual heroics, there is little capability for repeating successful processes unless the key individuals remain the same. This dynamic never scales and in the worst cases the organization is impaired every time one of “these key employees” leaves taking their expertise with them.
By contrast a Profile 3 (Integrated) organization has acknowledged the strategic and competitive value of information. This organization has defined an information management culture (framework) to satisfy business objectives. Initiatives have been undertaken enhance the organization’s ability to create value for customers rather than catering to individuals, departments, and business units. Architecture integrates data from every corner of the enterprise — from operational/transactional systems, multiple databases in different formats and from multiple channels. The key is the ability to have multiple applications share common “metadata” — the information about how data is derived and managed. The result is a collaborative domain that links previously isolated specialists in statistics, finance, marketing and logistics and gives the whole community access to company-standard analytic routines, cleansed data and appropriate presentation interfaces. Common characteristics include:
- Cross-enterprise information.
- Decisions made in the context of enterprise goals.
- Enterprise information-governance process.
- Enterprise data frameworks.
- Information-management concepts applied and accepted.
- Institutional awareness of data quality.
So how well do think adopting an enterprise analytic environment is going to work in a Profile I (Initiating) organization? Do you think we have a higher probability of success if we know the organization is closer to a Profile III (Integrated) or higher?
I thought so.
In this case, the sequencing should reflect a focus on actions that will move and evolve the organization from a 1 (Initiating) to a 2 (Consolidated), eventually arriving at a 3 (Integrated) profile or higher.
Understanding the key characteristics and distinct markers found in the organization you are planning for at this stage will be a key success factor. We want to craft a thoughtful sequence of actions to address organization and process related gaps in a way to that is meaningful. Remember has much as we wish, any attempt to jump to a higher profile cannot happen until ALL key characteristics are addressed and improved together. So if we are embarking on a truly valuable program remember this fundamental. In almost every roadmap I have reviewed or evaluated by others not very many of them seek to understand this critical perspective. Not really sure why this is the case since an essential element of success to any initiative is ensuring specific actionable activities and management initiatives include:
- Building organizational capability,
- Driving organizational commitment, and
- The program will not exceed the organization’s capability to deliver.
Results
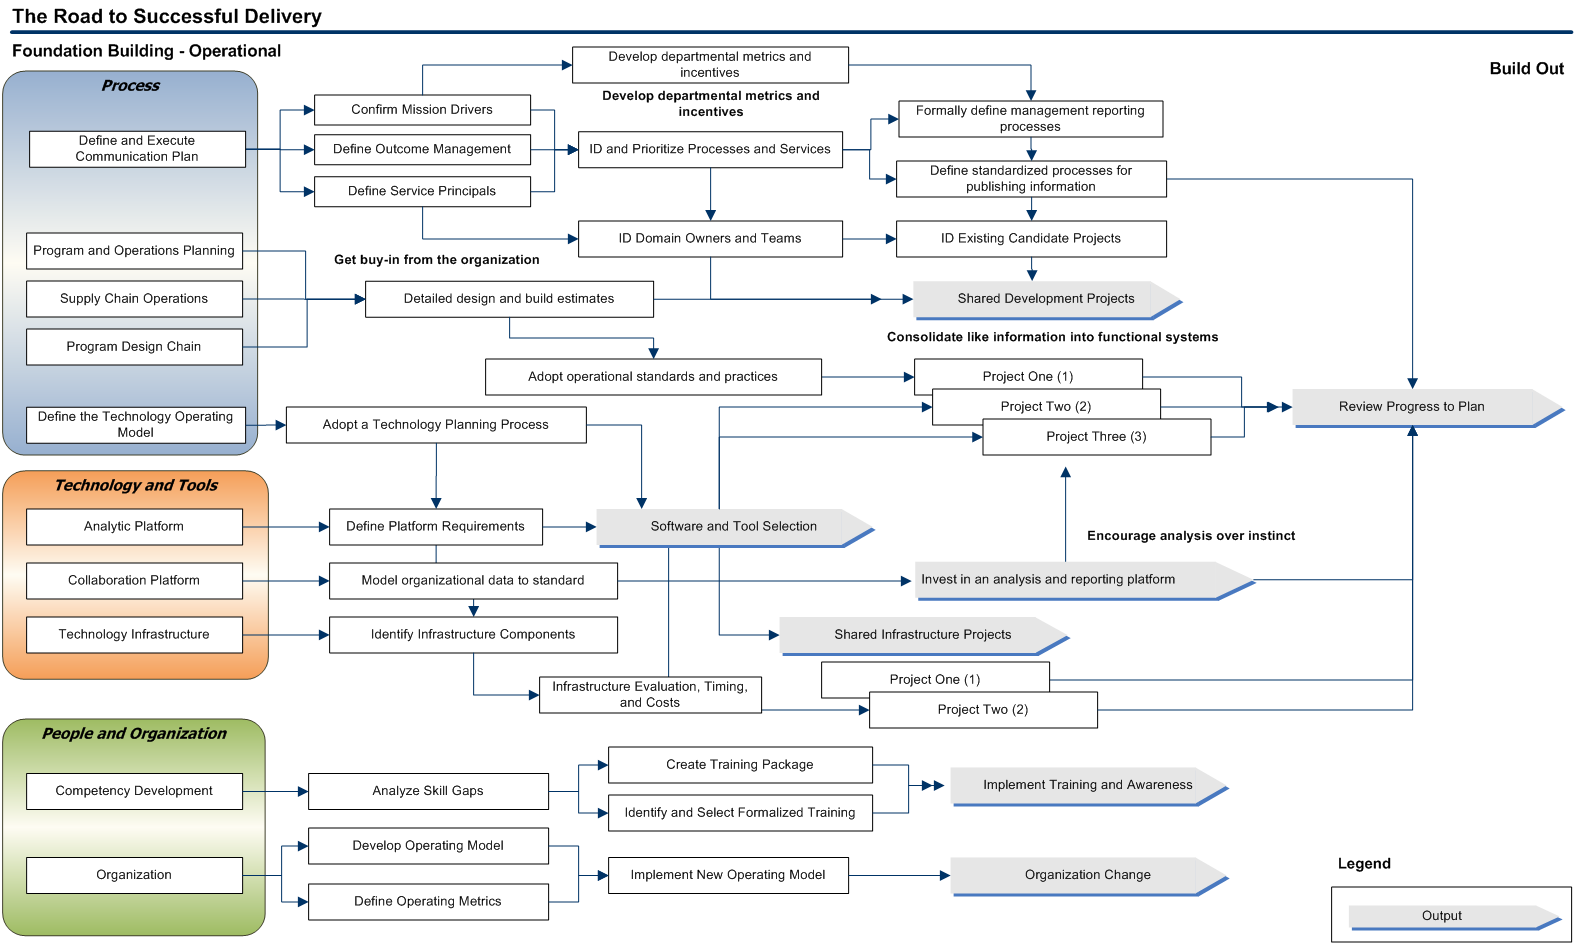
Now that we have gathered all the prioritized actions, profiled the organization’s ability to deliver, and have the right enabling technology decisions in the right order it’s time to group and arrange the findings. While the details should remain in your working papers there are a variety presentation approaches you can take here. I prefer to group the results into easy to understand categories and then present the high level projects together to the team as a whole. In this example (simplified and edited for confidentiality) I have gathered the findings into two visual diagrams illustrating the move from a Profile 1 (Operational) labeled Foundation Building, to a Profile II (Consolidated) labeled Build Out. I have also grouped the major dimensions (Infrastructure, Processes, Human Capital and Culture) into three categories labeled Process and Technology, and combined Human Capital and Culture into Organization to keep things simple.
First the Profile I diagram is illustrated below. Note we are “foundation building” or identifying the optimal sequence to build essential capability first.
The move to a Profile II (Consolidated) is illustrated below. In this stage we are now leveraging the foundation building from earlier actions to begin to leverage what is important and take advantage of the capability to be realized.
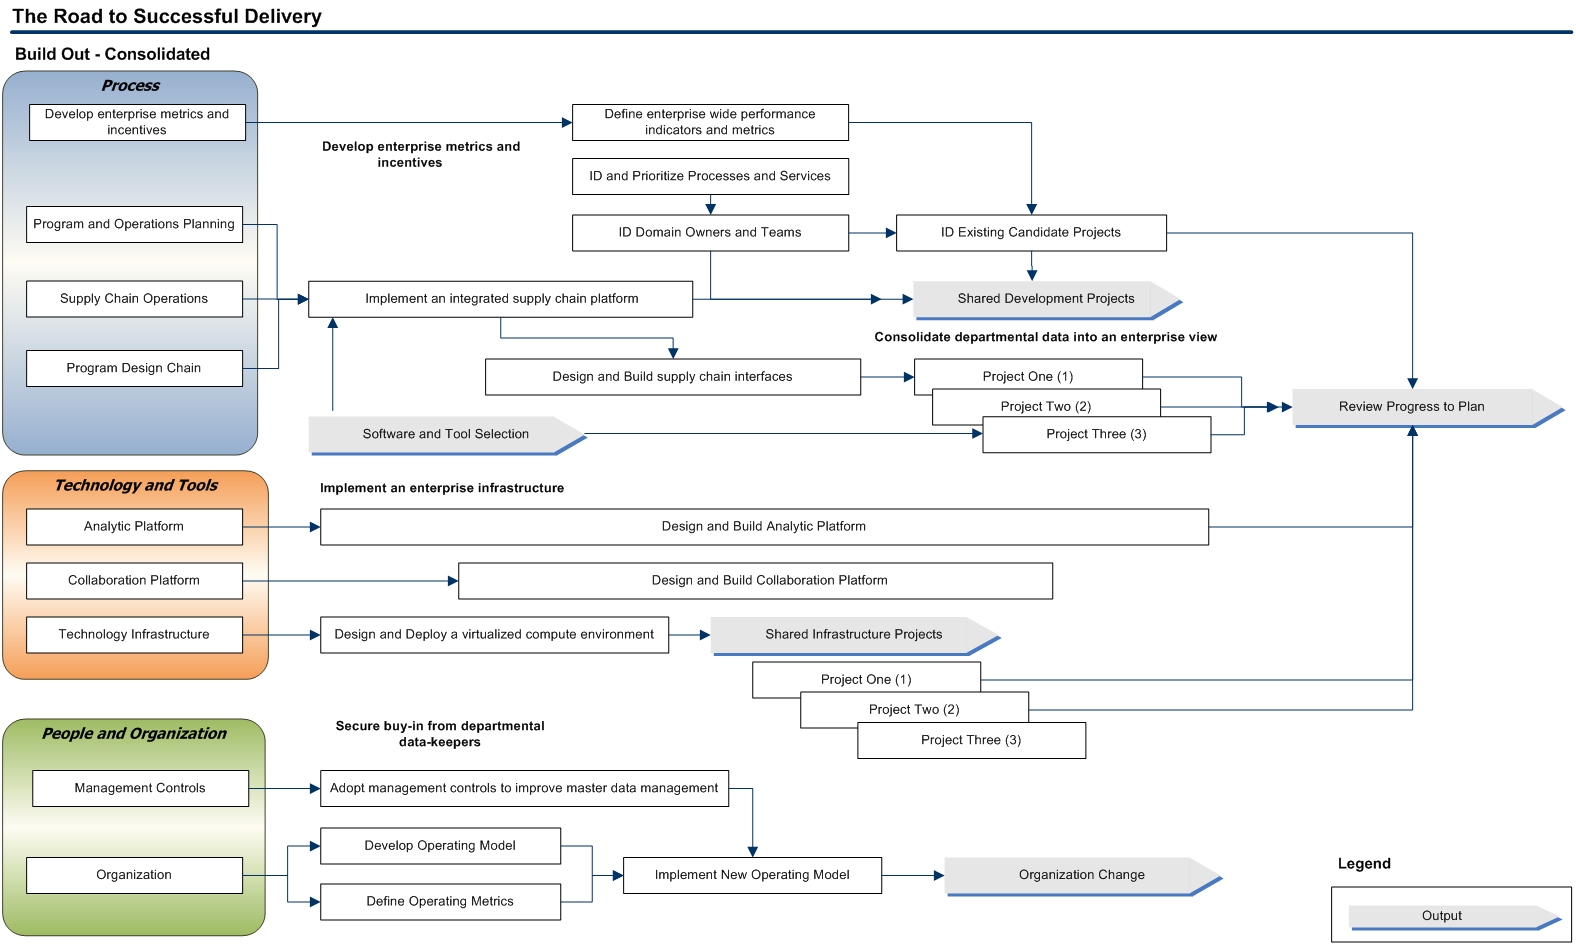
Note at this time there is no times scale used; only a relative size denoting an early estimate of the level of effort from the Gap Analysis findings. There is however a clear representation of the order of what actions should be taken in what order. With this information we are now ready to move to the next step to develop and publish the completed Road Map.
No hay comentarios:
Publicar un comentario